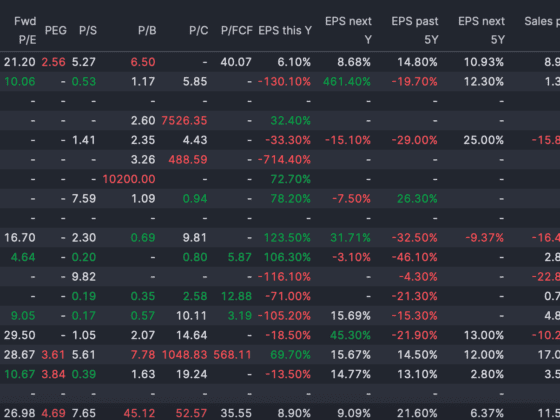
Ever wondered how to navigate stock screeners like Finviz for successful swing trading? Uncover the art of precision with our guide. From volatility indicators to catalysts, we’ve got your back. Ready to elevate your trading game? Dive into this must-read guide and harness the power of informed decision-making for unparalleled success in the stock market!
When using Finviz or any other stock screener for swing trading, the specific values you choose for each criterion may vary based on your personal trading style, risk tolerance, and market conditions. Here’s a general guideline for selecting values in each category:
- Volatility:
- Average True Range (ATR): A common measure of volatility. You might consider stocks with an ATR higher than 1 for increased price movement.
- Beta: A measure of a stock’s volatility in relation to the market. A beta greater than 1 indicates higher volatility.
- Liquidity:
- Average Volume: Consider stocks with a minimum average daily volume to ensure liquidity. This value can vary, but a common threshold might be 500,000 or 1 million shares.
- Trend Analysis:
- Moving Averages: Look for stocks trading above their moving averages. For example, you might filter for stocks with a current price above the 50-day moving average.
- Chart Patterns: Identify stocks forming bullish or bearish chart patterns, such as triangles, flags, or head and shoulders.
- Catalysts:
- Earnings Dates: Check for stocks with upcoming earnings reports, as these can act as catalysts for price movements. You might consider stocks with earnings in the next 1-2 weeks.
- News and Events: Use a news feed or calendar to be aware of any upcoming events, product launches, or industry news that could impact the stock.
- Relative Strength:
- Relative Strength Index (RSI): Look for stocks with RSI values indicating either overbought or oversold conditions. For example, an RSI below 30 might indicate oversold conditions, while an RSI above 70 might indicate overbought conditions.
- Performance vs. Index: Consider stocks that have outperformed their sector or the broader market over a specific time frame.
- Fundamental Analysis:
- Price-to-Earnings (P/E) Ratio: Consider stocks with reasonable P/E ratios, but this can vary depending on the industry. For example, a P/E ratio below 20 might be considered reasonable.
- Earnings Growth: Look for stocks with positive earnings growth. You might set a minimum threshold, such as 10% or higher.
Sample Screener https://finviz.com/screener.ashx?v=111&f=sh_avgvol_o2000,sh_price_o15,ta_averagetruerange_o1.5&ft=3
Remember, these are general guidelines, and you should adjust them based on your own risk tolerance, trading strategy, and market conditions. Additionally, always conduct thorough research and analysis before making any trading decisions.


